Create a Summary Report:
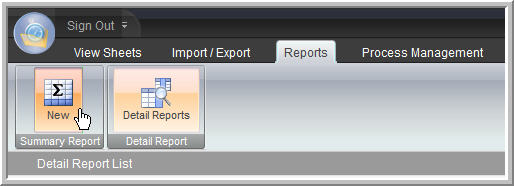
1. Click on the "Reports" tab

2. Click on the "New" button within the "Summary Report" ribbon group.
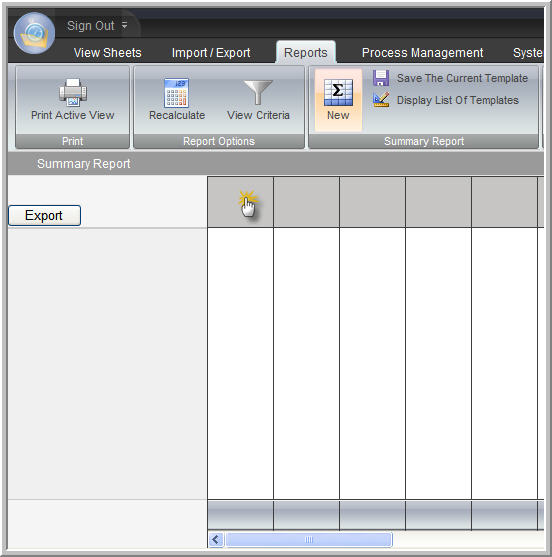
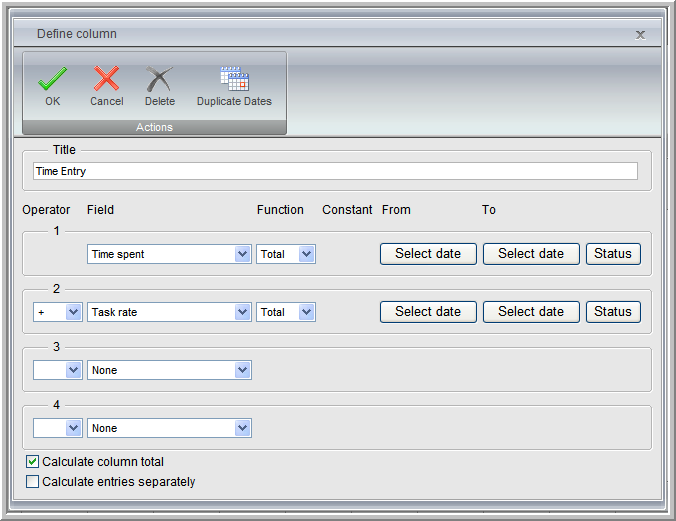
3. On the first column located on the far left side double click on the blank field above the column to open the "Define Column" dialog box.
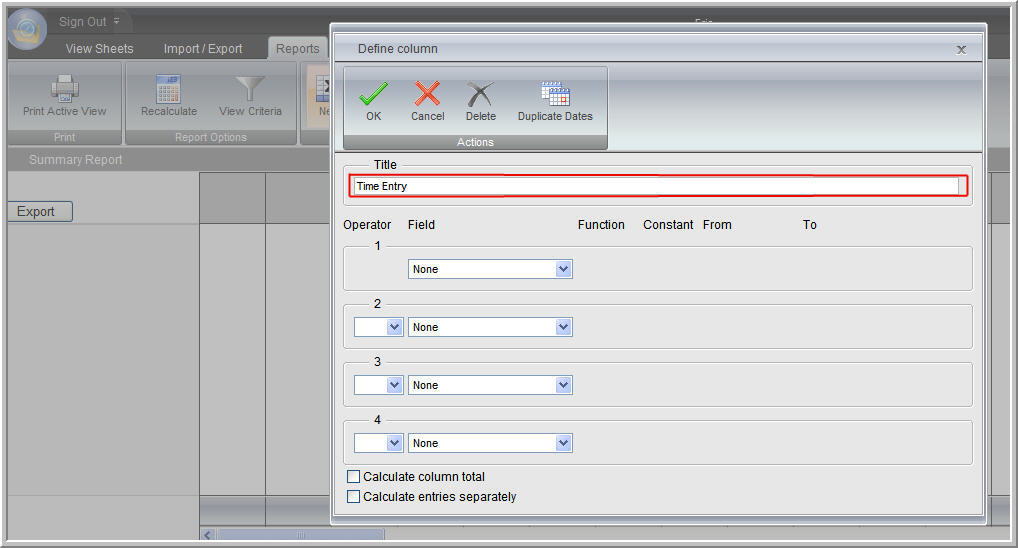
4. Enter in a title for the first column. This name will appear within what used to be the blank field above the column in step 3.
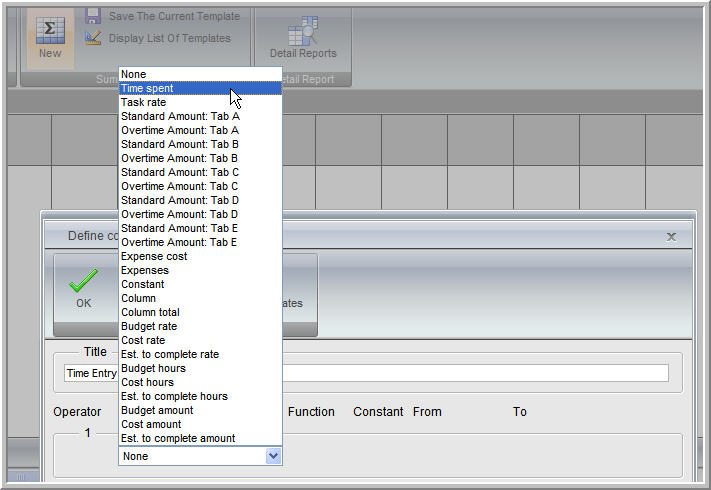
5. Choose the desired "Field" and "Function" from the drop down menu.
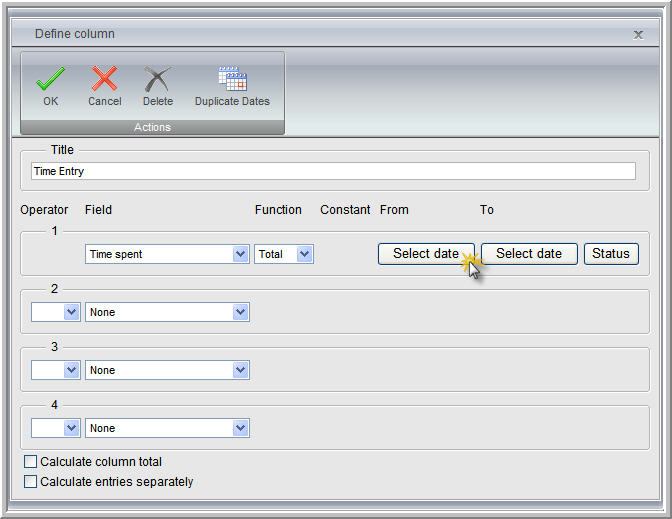
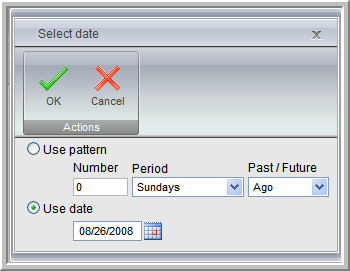
6. Choose the corresponding "From" and "To" dates by selecting the "Select dates" button.
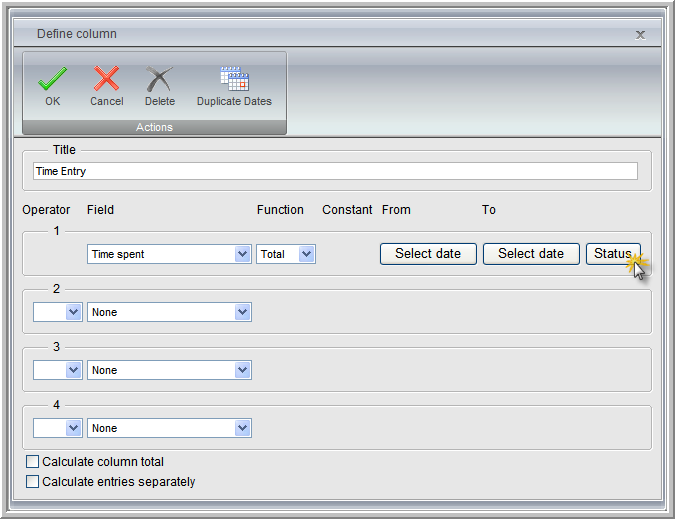
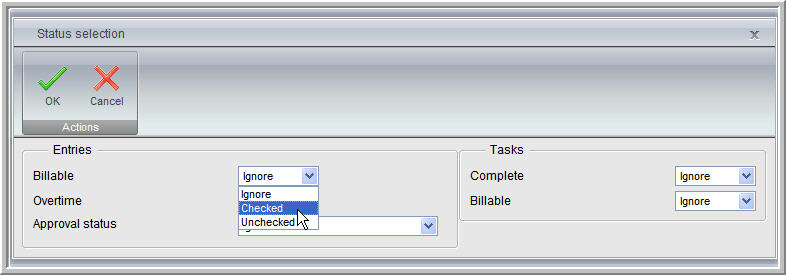
7. To further filter your selection click on the "Status" button and choose the corresponding "Entries" and or "Tasks" statuses.
8. If this column requires only one dedicated field click on the "OK" button to save the settings and continue with step 10.
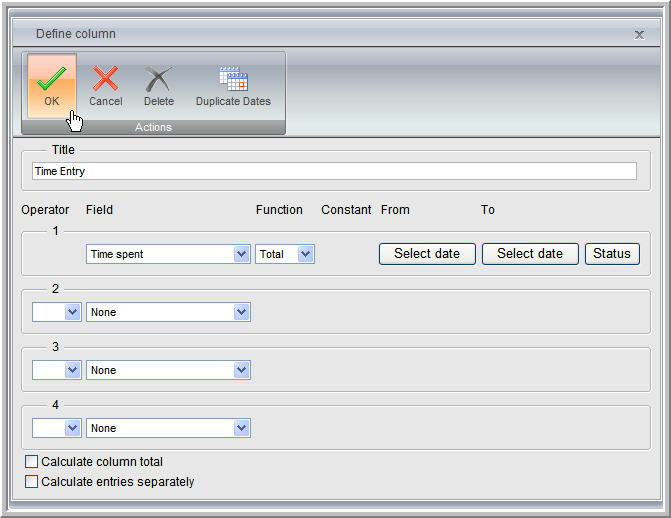
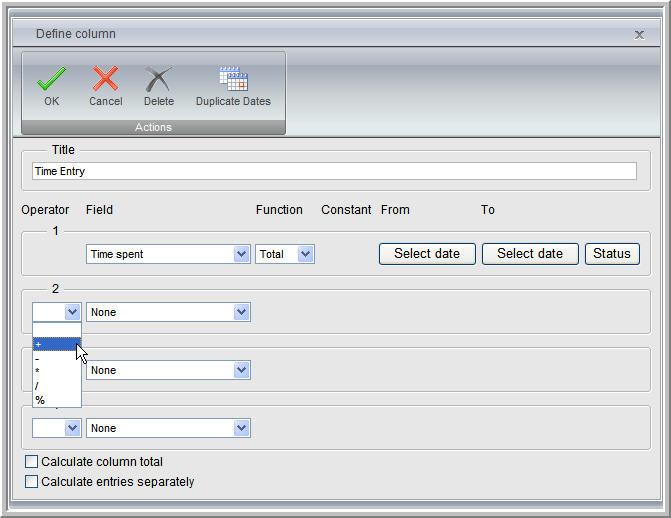
9a. If this column requires more than one field then select the appropriate binary operator from the drop down menu (+ - * / %)
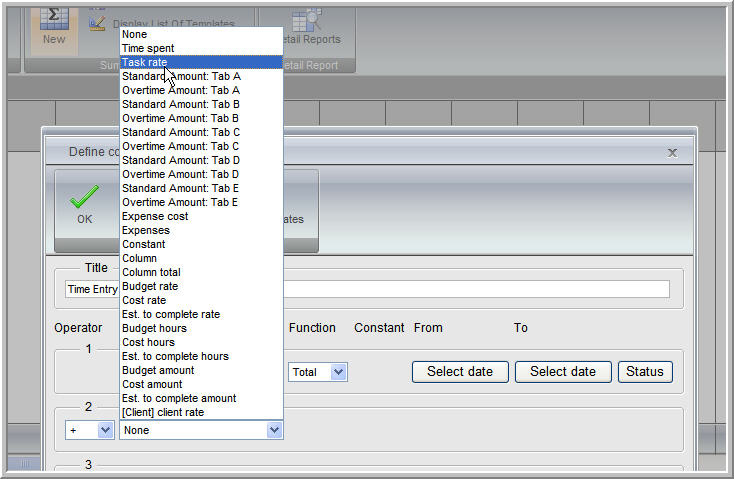
9b. Again choose the desired "Field" and "Function" from the drop down menu.
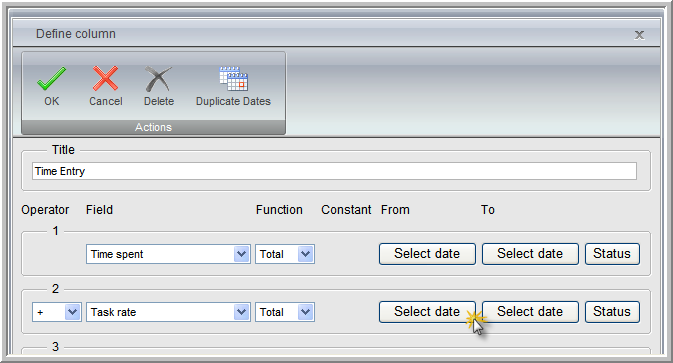
9c. Choose the corresponding "From" and "To" dates by selecting the "Select dates" button. When finished click on the "OK" button to save the settings and continue with step 10.
9d. Check box option: "Calculate column total" - Determines if Office Timesheets displays the column total at the bottom of the column
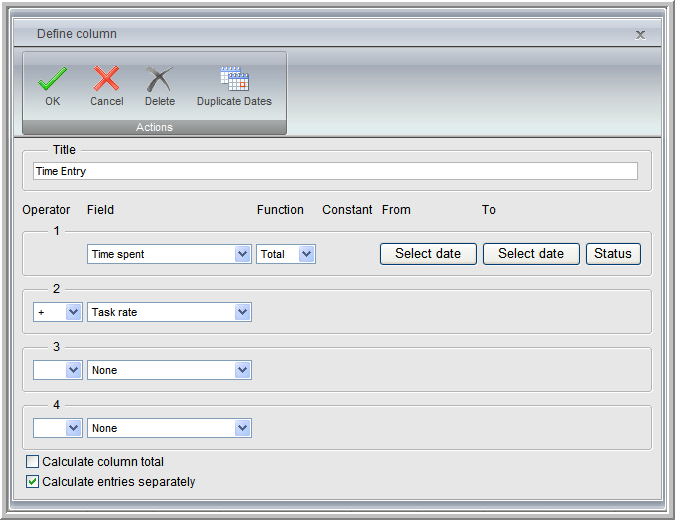
9e. Check box option: "Calculate entries separately" - Mark this check box to change the calculation method for the column. With this method, Office Timesheets will apply each operator to each entry separately, rather than scanning all entries for the first field. Function and date selection items are not viewable for "Field" 2-4.
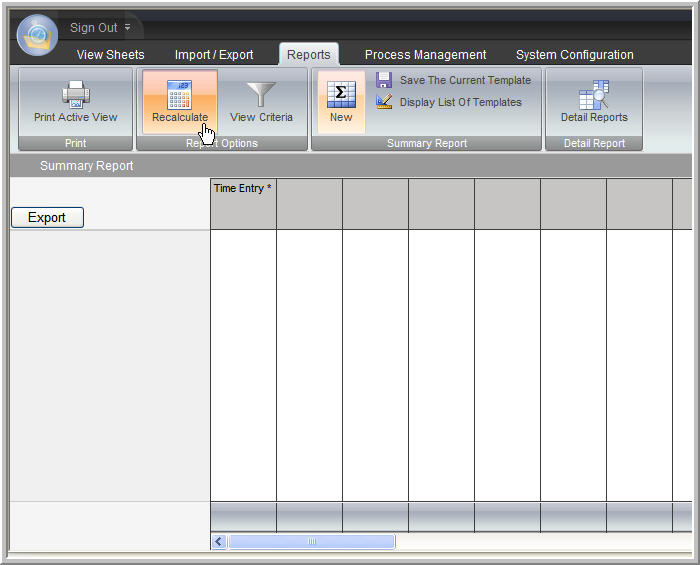
10. To test your current configuration click on the "Recalculate" button and the Summary Report will generate and display your column's calculations
11. To further filter what will be displayed within the report click on the "View Criteria" button. From the View Criteria dialog box you may choose which Elements displays within the Report.
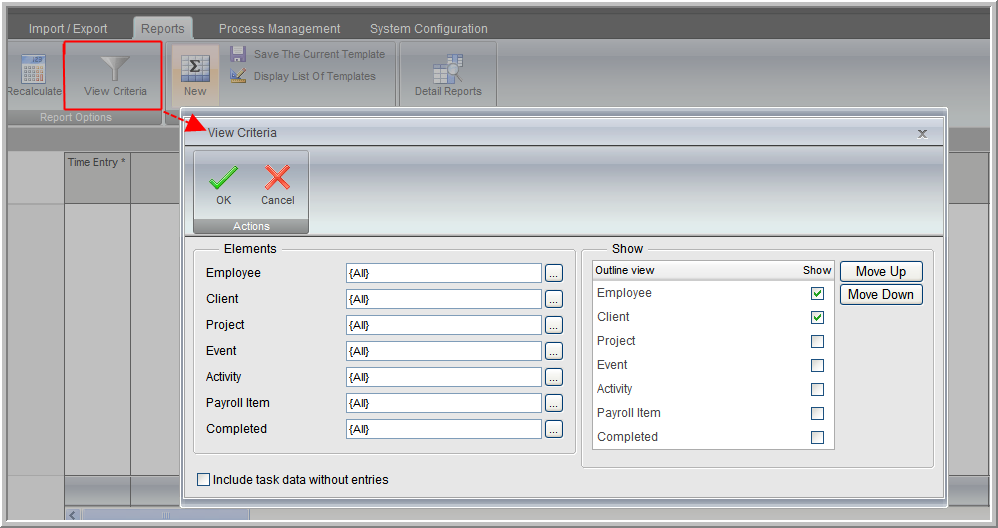
11a. To make a selection click on the select button located to the left of each field under the "Elements" section. The "Select element" field will appear. You may filter the names by choosing a specific "Group".
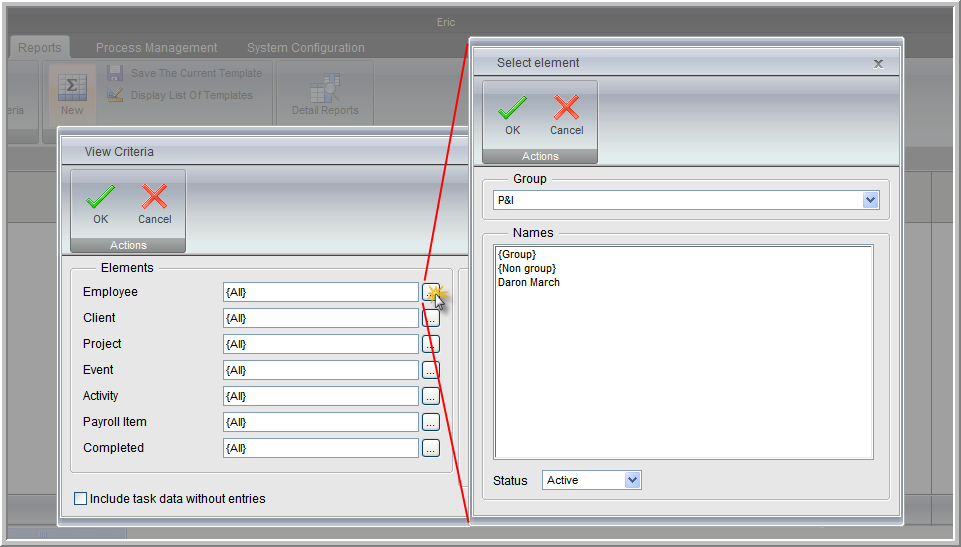
11b. The "Active" "Status" field only displays those Elements which are Active and Inactive Elements will not be shown. To display Inactive Elements choose the "All" "Status" option.
11c. There are several "Select element" dialog boxes which contains the "Show as" option. Choosing the "Name" options displays the full name of the element whereas the "Abbreviations" will display all names in an abbreviated form.
11d. Within the "View Criteria" dialog you may further filter out what will be displayed within the report by marking/unmarking the "Show" check boxes next to the corresponding Element as seen in step 11. Select the "OK" button to save the changes.
12a. If the report only requires one column you must click on the "Save The Current Template" button, create a "Name", and hit "OK" to save your entire report. Failure to do so may result in the loss of settings previously configured. So if you need view information in another tab within Office Timesheets your report template will be saved.
NOTE: If a second column is needed simply double click on the blank field above the column to open the "Define Column" dialog box.

12b. To retrieve your report template choose the "Display List Of Templates" button and select your template.

13. If a second column was created, a 3rd column can be configured to display the total of the 1st and 2nd column. To display this total open the 3rd column and choose the "Column" option for both the 1st and 2nd "Fields". The "Constant" field will now appear. For the first "Column" option enter in "1" as this represents the total amount for column 1. Enter in "2" for the second "Column" option as this represents the total amount for column 2. Choose the appropriate binary operator from the drop down menu (+ - * / %) and hit the "OK" button. Select the "Save the Current Template" button to save the new settings.
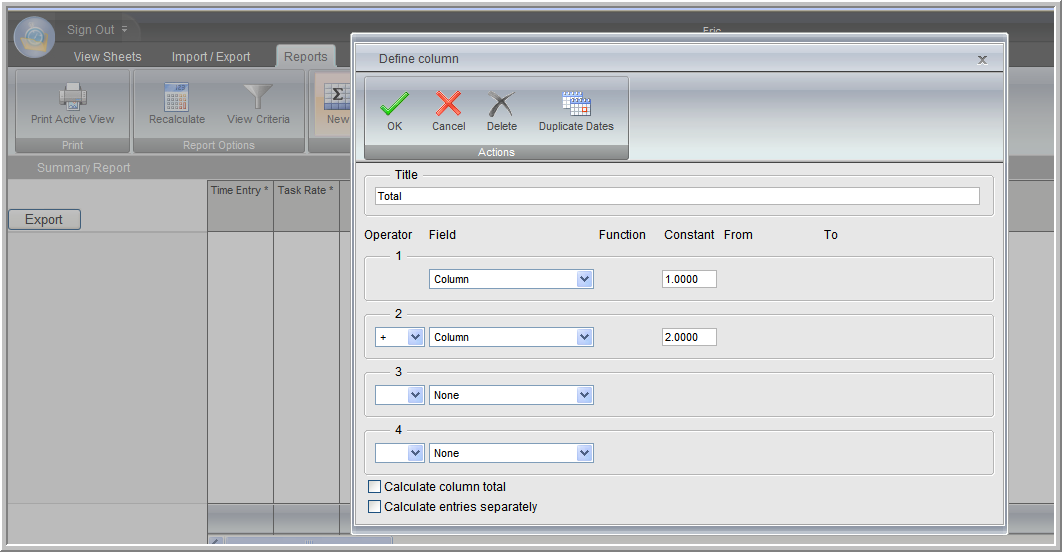
14. Choose the "Recalculate" button to generate the new amounts for each column.
Please note: the "Standard Amount: Tab" is the Product of "Time Spent" * "The rate of the specified tab" |